What are the Benefits of Excel
Excel offers powerful data analysis and visualization tools. It streamlines complex calculations with ease. The versatility of Microsoft Excel is unrivaled in data management and analysis. Known for its robust features, it caters to a wide array of business needs, from simple data tracking to complex statistical analysis. Professionals across…
Excel offers powerful data analysis and visualization tools. It streamlines complex calculations with ease.
The versatility of Microsoft Excel is unrivaled in data management and analysis. Known for its robust features, it caters to a wide array of business needs, from simple data tracking to complex statistical analysis. Professionals across industries leverage Excel to organize data efficiently, perform financial modeling, and create detailed reports.
Its grid interface allows for the convenient arrangement of information, making it accessible even to those with basic computer skills. Advanced users appreciate the extensive array of formulas and pivot tables that Excel provides, ensuring manipulation of large data sets is both seamless and precise. The software’s capability to integrate with other applications and its support for macros automate repetitive tasks, saving valuable time and reducing the margin for error. Its universal application and ease of use have made it an indispensable tool in the modern workplace.
Credit: www.elearners.com
Introduction To Excel’s Versatility
The versatility of Microsoft Excel is unmatched, making it a cornerstone software in countless industries. This powerful tool’s utility spans from simple data entry to complex statistical analyses, fitting the needs of various professional domains. Let’s delve into how Excel’s adaptability makes it a universal solution for numerous tasks and projects.
Popular Uses In Various Industries
Excel is widely regarded as a cross-industry staple for its array of functions. Here’s an overview:
- Finance: Budgeting, forecasting, and financial modeling.
- Marketing: Campaign tracking, ROI analysis, and market research.
- Human Resources: Payroll processing, employee database management, and scheduling.
- Education: Gradebooks, attendance records, and lesson planning.
- Healthcare: Patient records, treatment analysis, and inventory management.
Excel’s Role In Data Analysis And Reporting
Data analysis and reporting are at the heart of Excel’s power. With Excel, you can:
| Process | Function |
|---|---|
| Data Sorting: | Organize information to identify trends. |
| Graphs and Charts: | Visualize data for better insights. |
| Pivot Tables: | Summarize large datasets quickly. |
| Formulas: | Automate calculations and analyses. |
These features are vital for making accurate decisions based on quantitative data.
Streamlining Calculations
Streamlining calculations in Excel transforms complex data management into a simpler, more efficient process. This powerful tool swiftly manages numbers, making it perfect for both beginners and seasoned professionals alike. Let’s explore the benefits of harnessing Excel’s calculation prowess.
Automating Complex Calculations
Excel’s ability to automate complex calculations saves valuable time. By utilizing a variety of functions and features, manual computation turns into a thing of the past. Excel handles these tasks:
- Mathematical Operations: From basic addition to sophisticated statistical analysis.
- Data Analysis: Perform large-scale computations with a single formula.
- Financial Forecasts: Project future trends using advanced Excel functions.
Automatic recalculation ensures all related data updates instantly with every change, maintaining accuracy without extra work.
Enhancing Productivity With Formulas
Productivity soars when harnessing Excel’s formulas. They cut down on repetitive tasks and human error. Benefits include:
| Feature | Benefit |
|---|---|
| Cell Referencing | Link formulas to specific cells for dynamic data use. |
| Formula Auditing | Trace precedents and dependents to evaluate formula parts. |
| Array Formulas | Perform multiple calculations on sets of data for comprehensive results. |
By automating routine operations, Excel not only enhances productivity but also empowers users to focus on strategic analysis and decision-making.
Data Organization And Management
Excel shines as a powerful tool for organizing and managing data. Users can store vast amounts of information efficiently. Excel’s robust features help keep data accessible and understandable. Let’s explore how Excel masters data organization and management.
Efficient Sorting And Filtering Of Data
Excel makes handling data simpler with its sorting and filtering options. These features enable users to organize data in a meaningful way. With just a few clicks, you can sort lists of names, dates, or numbers. Excel allows users to quickly find the data they need by using filters. This cuts down on time spent searching for information.
For instance, imagine having a list of sales data. You can sort this data by the highest selling products. Or you can filter to view only sales from a particular region. Both features are essential for swift data analysis.
Using Tables And Pivot Tables For Organization
Excel’s table function changes raw data into structured tables. This makes the data easier to read and manage. Users can add, remove, or adjust data in an organized manner. Tables maintain data integrity and ensure consistent formatting.
Here is why tables are essential in Excel:
- Data stays organized, even when new entries are added.
- Headers stay visible while scrolling, making navigation easier.
- Automatic column filters are added for quick sorting and filtering.
Pivot tables take data organization to the next level. They summarize large data sets with ease. Pivot tables can group, count, and total data, and they can be rearranged to highlight different aspects of the information. The ability to quickly pivot data allows for dynamic analyses and insights.
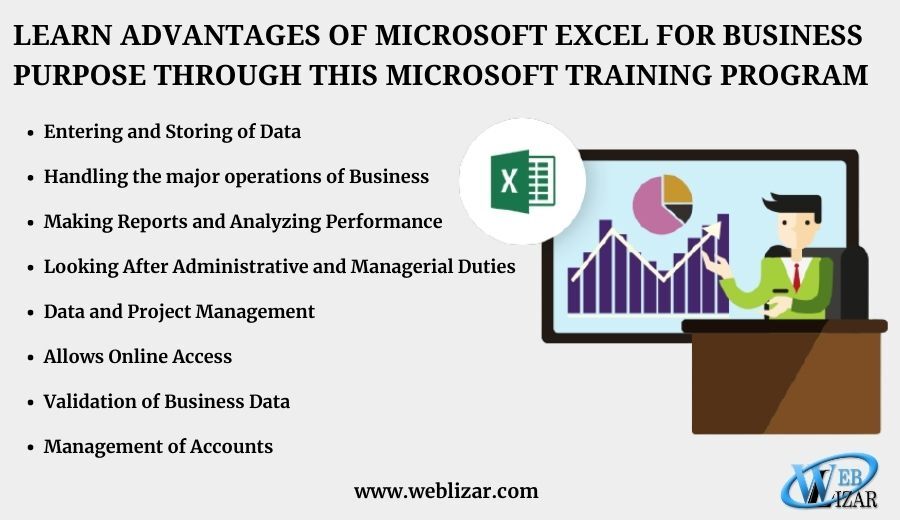
Credit: weblizar.com
Visualization Tools In Excel
Excel’s Visualization Tools transform raw data into clear insights. They make patterns and trends easier to understand. With these tools, you can present data in a visual context. This enhances storytelling with numbers. Excel offers various tools to bring your data to life.
Creating Impactful Charts And Graphs
Excel simplifies chart creation. Select your data and choose a chart type. Excel does the rest. With a few clicks, create bar graphs, pie charts, and line graphs. These visuals help readers grasp complex datasets quickly.
- Bar Graphs: Compare different groups
- Pie Charts: Show parts of a whole
- Line Graphs: Display changes over time
Here’s how to insert a chart:
- Select the data range for your chart.
- Go to the Insert tab.
- Click ‘Insert Column or Bar Chart’ for bar graphs.
- Pick the desired chart style.
| Chart Type | Use Case |
|---|---|
| Column Chart | Comparing categories side-by-side |
| Line Chart | Showing trends over intervals |
| Pie Chart | Illustrating proportions |
Conditional Formatting For Data Insights
Conditional formatting highlights key data. It uses color coding for quick analysis. Pick rules to apply, like ‘greater than’ or ‘top 10%.’ Excel will color-code the cells automatically.
Here’s how to apply conditional formatting:
- Select the cells you want to format.
- Find the ‘Home’ tab.
- Click ‘Conditional Formatting.’
- Choose a rule.
- Set up the formatting options.
For example, apply these rules for quick insights:
- Color Scales: Use two colors to show value ranges.
- Data Bars: Insert bars within cells to reflect value size.
- Icon Sets: Use symbols like arrows for trends.
Collaboration And Sharing
Collaboration and Sharing in Excel transforms how teams manage data. It makes working together not just possible but efficient and streamlined. Teams can merge their expertise, update in real time, and achieve their goals faster.
Seamless Teamwork With Shared Workbooks
Shared workbooks break down barriers in Excel. Team members can work simultaneously on data. This prevents version control issues. Excel tracks changes by each user, making teamwork easy.
- Real-time collaboration keeps everyone in sync.
- Multiple people can edit and view at the same time.
- Changes are automatically saved and synced.
Integration With Cloud Services
Cloud services like OneDrive and SharePoint enhance Excel’s power. They let users access workbooks from anywhere, on any device. Excel integrates seamlessly with these services. This ensures data safety and accessibility.
| Cloud Service | Benefits |
|---|---|
| OneDrive | Easy file access, sharing, and storage |
| SharePoint | Centralized team site for collaboration |
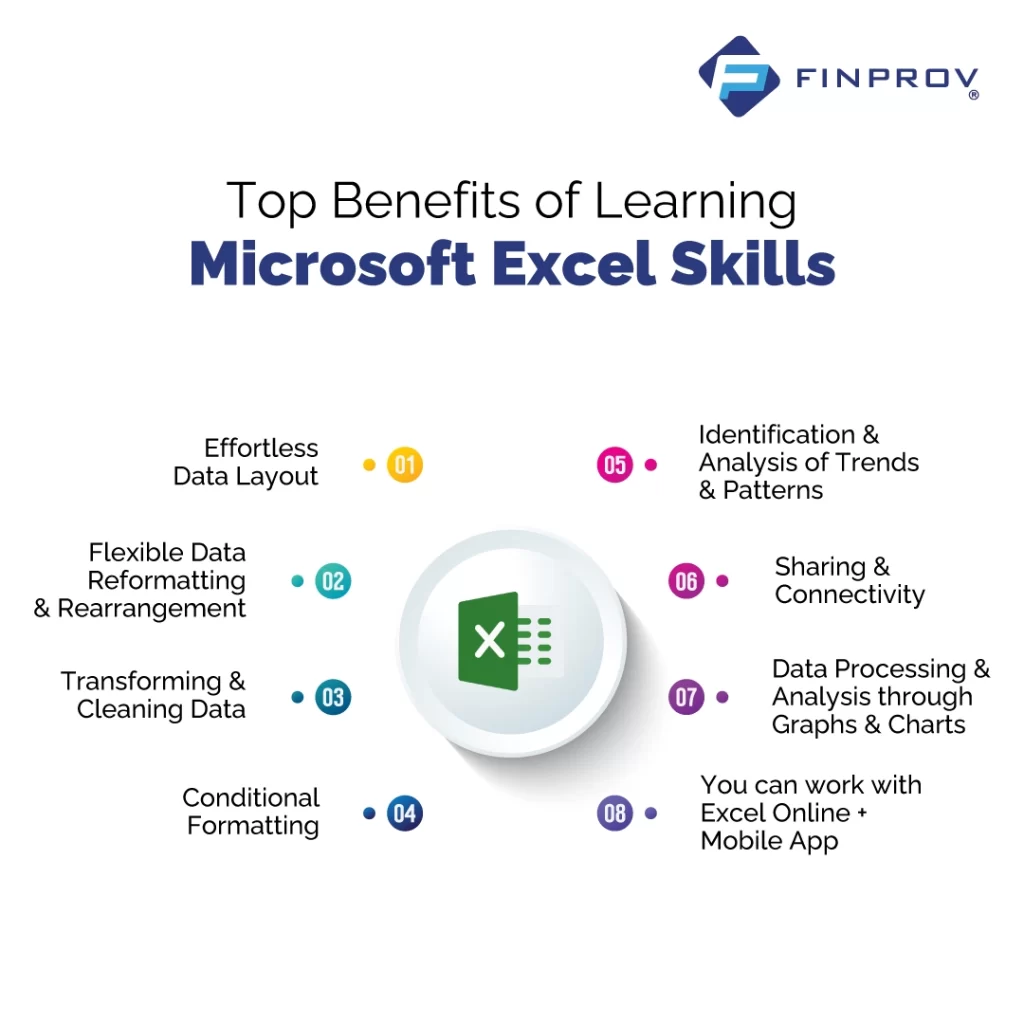
Credit: finprov.com
Advanced Data Analysis Tools
Excel’s advanced data analysis tools are a goldmine for professionals aiming to uncover insights from their data. These tools enable users to manipulate, analyze, and visualize data beyond basic spreadsheet capabilities. Now, let’s dive deep into some of these sophisticated features within Excel.
Exploring Power Query And Data Models
Power Query is Excel’s powerhouse for data transformation and preparation. With Power Query, users can:
- Connect to various data sources, including databases, online services, and files.
- Transform and clean data effortlessly using a user-friendly interface.
- Combine data from multiple sources, creating comprehensive data models.
Data Models in Excel allow users to create complex data structures. Use Data Models to:
- Build relationships between different data tables.
- Create calculated columns and measures using DAX formulas.
- Analyze large datasets with enhanced performance.
Leveraging What-if Analysis And Solver
What-if analysis tools in Excel help predict outcomes by altering data. Key tools include:
| Tool | Use |
|---|---|
| Scenario Manager | Compare different sets of data on the same formula. |
| Data Tables | View changes across various data points simultaneously. |
| Goal Seek | Find input values to achieve a specific outcome. |
Solver, another robust Excel feature:
- Optimizes resources within constraints.
- Finds the best solution by changing multiple variables.
- Is ideal for complex, constraint-based optimization problems.
Using these advanced data analysis tools, Excel transforms from a simple spreadsheet program to a powerful data analysis engine.
Excel In Business Intelligence
Excel plays a crucial role in Business Intelligence (BI). Many professionals rely on Excel for complex data analysis and reporting. Excel provides tools to transform raw data into actionable insights, making it indispensable.
Power Bi And Dashboard Creation
Microsoft Excel works seamlessly with Power BI, Microsoft’s interactive data visualization tool. Users can create comprehensive dashboards straight from their spreadsheets. Dashboards display key performance indicators and trends. Excel’s powerful PivotTables and PivotCharts bolster this process.
- PivotTables: Summarize data with custom reports.
- PivotCharts: Turn data into visual charts.
- Slicers: Filter data for focused insights.
Connecting To External Data Sources
Excel can connect to various data sources. This feature enhances BI tasks. Users pull data from databases, online services, and other sources into Excel. Tools like Power Query simplify data integration.
| Data Source Type | Connection Benefit |
|---|---|
| Databases | Access large volumes of data |
| Online Services | Real-time data analysis |
| Other Spreadsheets | Combine multiple data sets |
Excel enhances data connectivity through:
- Power Query: Import and clean data.
- Data Models: Link different data tables.
- Connections: Access external databases.
Customizability And Expansion
Microsoft Excel’s power shines in its ability to grow with your needs. Whether you’re a data analysis rookie or a seasoned pro, Excel’s customizability and expansion options are a game-changer. With tools to develop your own macros and VBA scripts, as well as the ability to expand functionality through add-ins, Excel adapts to your unique workflows and processes.
Developing Macros And Vba Scripting
Macros and VBA scripting thrust Excel’s efficiency into overdrive. These tools automate repetitive tasks, saving you time and reducing errors. Here’s why they’re beneficial:
- Quick actions: With a single click, run complex sequences.
- Consistency: Get the same results every time you run a macro.
- Personalization: Tailor macros to your specific tasks.
With VBA, or Visual Basic for Applications, dive deeper into customization:
- Advanced automation: Craft scripts that handle data manipulation.
- User-defined functions: Create custom functions for unique calculations.
- Integration: Control other Microsoft Office applications through Excel.
Expanding Functionality With Add-ins
Add-ins introduce new tools and features to Excel. They enable you to do more:
| Add-In Category | Benefits |
|---|---|
| Data Analysis | Uncover deeper insights with advanced analytical tools. |
| Productivity | Streamline workflow with task automation and shortcuts. |
| Visualization | Create engaging, informative charts and graphs. |
| Collaboration | Share and co-edit spreadsheets in real-time. |
These are just a few ways add-ins can transform your Excel experience:
- Easy to install: Add them directly from Excel’s in-app store.
- Large selection: Choose from a wide range of categories.
- Custom solutions: Find add-ins tailored to your industry or task.
Cost-effectiveness And Accessibility
Microsoft Excel stands out as an incredibly cost-effective and accessible tool. It provides a vast array of functionalities that cater to a wide spectrum of business needs. From local startups to global corporations, Excel finds a spot in daily operations, proving its immense value. Its licensing options and the availability of training materials make it a go-to solution for those looking to optimize their budget while maintaining productivity.
Affordability Of Excel For Small Businesses
For small businesses, Excel offers a budget-friendly solution to manage data efficiently. With its flexible pricing and the potential to scale as a business grows, Excel presents an investment that aligns with financial realities of startups and small enterprises. The benefits of Excel for small businesses include:
- Low initial cost
- Scalable features to support business growth
- Reduction in the need for specialized software
Excel Training And Resources Availability
Part of Excel’s accessibility is its wide range of training materials and resources. Users can easily find tutorials, online courses, and community support to polish their skills at any level. This ensures a smooth learning curve and maximizes the software’s effectiveness. Key points about training and resource availability include:
- Free tutorials from Microsoft
- Affordable online courses
- Active community forums
- Extensive library of templates and add-ins
Future Prospects Of Excel
Microsoft Excel is not just about numbers and spreadsheets. It’s a tool that keeps getting better with time. Excel’s future shines brightly as it evolves to meet modern data needs. Let’s dive into the exciting developments on the horizon for this indispensable software.
Ongoing Updates And New Feature Additions
Excel constantly upgrades, aiming to streamline your data management experience. The future of Excel includes:
- New functions that simplify complex calculations
- Improved analytics features for better insights
- User interface enhancements for greater accessibility
- Collaboration tools for team projects
Users can anticipate regular feature rollouts. These improvements keep Excel at the forefront of data analysis tools.
Evolving With Artificial Intelligence
Excel is embracing AI to transform how we work with data. Prospective AI integrations include:
| AI Feature | Benefit |
|---|---|
| Smart Data Insights | Quick, advanced data trends analysis |
| Natural Language Queries | Easy data interrogation with plain English |
| Automated Data Cleaning | Efficient removal of data duplicities and errors |
| Pattern Recognition | Simplify repetitive tasks by learning user patterns |
These AI features will undoubtedly make Excel an even more powerful ally in data-driven decision making.
Frequently Asked Questions Of What Are The Benefits Of Excel
How Does Excel Improve Data Analysis?
Excel provides powerful tools for data analysis, such as pivot tables, conditional formatting, and various chart types. These features enable users to process large datasets, uncover patterns, and make informed decisions based on their data analysis efforts.
Can Excel Help In Project Management?
Absolutely, Excel’s features like Gantt charts, timelines, and task tracking templates are useful for project management. These tools assist in organizing tasks, deadlines, and resources, making it a versatile tool for project managers to maintain oversight of their projects.
What Are Excel’s Main Advantages For Businesses?
Excel offers businesses the advantages of flexibility, scalability, and extensive support for complex calculations. It also supports data visualization and has a wide range of functionalities that cater to diverse business needs, from finance to inventory management.
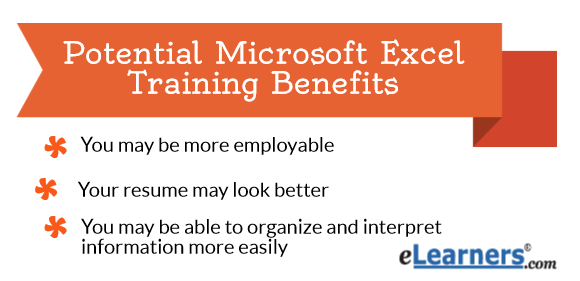
Is Learning Excel Beneficial For Career Growth?
Yes, proficiency in Excel is often a desirable skill across many industries. It can enhance an individual’s analytical abilities and efficiency, which are valuable assets to employers, potentially leading to career advancement and job opportunities.
Conclusion
Wrapping up, Excel offers a suite of features that enhance data management and analysis for diverse user needs. With its robust formulas, dynamic charts, and collaboration options, it stands out as a key tool for businesses and individuals alike. Embrace Excel’s capabilities to harness data’s full potential and make informed decisions.